The plot and collect functions
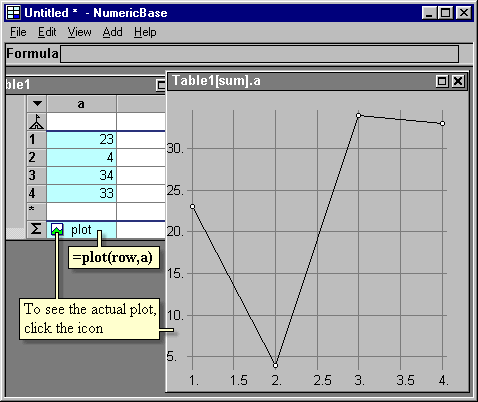
The plot and collect functions.The plot function scans the rows of the table and collect the numerical data to a create a plot. The function gets two arguments, the first for x values, and the second for y values.
The following screenshot shows example of plot usage. To see the actual plot, click the plot icon

Screenshot: Using the plot function
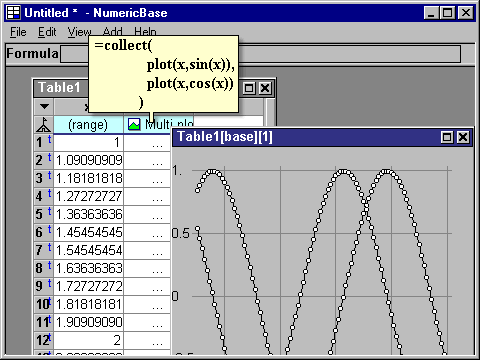
The collect function let you combine several plots into one display. You can use it to collect all the plots as shown in the Saving account scenarios example. You can also use it locally to combine several plots as shown in the following example:

Screenshot: using the collect function
Copyright © 2003 - 2026 by symbol click. Contact info


 Overview
 Value types